Everything is tracked on our platform and made available to you on dashboards and excel reports.
What all we track and store for you to analyze your journey
Customer journey
Total customer connects
Drops during the journey
Per customer queue wait time
Live customer queue
Time stamp of each connect
Business success numbers
Product or use case wise data
Total and unique attempts
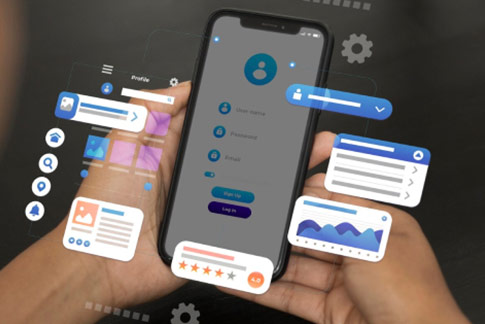
The video interaction
Number of video calls
Length of each video call
Number of docs captured
Complete workflow tracking
Chat messages
Files shared
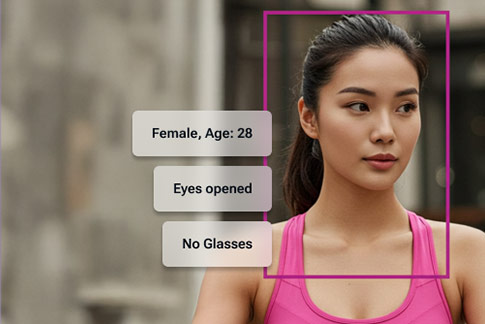
Customer device details
Customer IP and location
Employee performance
First login and last logout time
Number of calls handled
Total call and video time
Average handling time
Breaks and on job time
Performance as per business
Employee bandwidth
Team or group wise data
Video call center level analysis
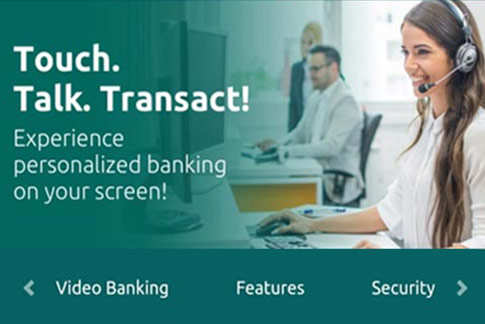
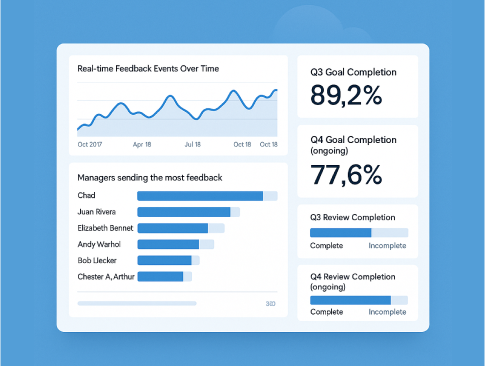
A video banking platform needs to be analyzed like a video call center. All our dashboards and reporting modules help analyze every part of the operations, customer journey and performance metrics.
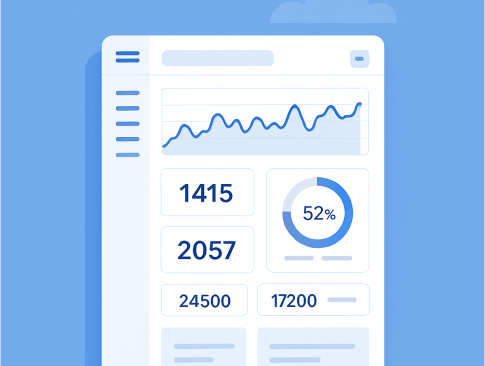
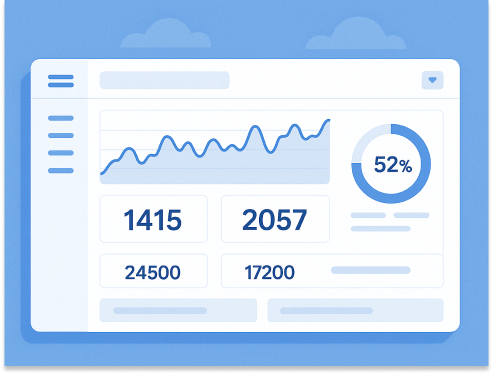
Master summary dashboard
A live and real time dashboard with total call volume, Business success numbers, Average call time or AHT.
Employee group or pool wise dashboard
Create your own employee groups basis product, line of business, location etc and analyse their specific data in a real time dashboard.
Employee performance dashboard
Track the performance of each employee wrt the calls assigned to them, business success numbers, AHT, call time, break time etc.
Live customer queue
Know the number of customers in queue per process or team in real time and increase or decrease your workforce.
Video Bank
All recorded videos available in a video bank and searchable using various parameters. Just click on a video and play.
Customized excel reports for any kind of data
We can customize any excel report for you with any data that’s stored with us so that your business decision becomes easier.